|
PIAS Manual
2026
Program for the Integral Approach of Shipdesign
|
|
PIAS Manual
2026
Program for the Integral Approach of Shipdesign
|
Having started up Hydrotables, one enters the main menu, the various options of which are explained in more detail in the following sections.
At this option, for each table or diagram the desired parameters can be specified, such as the trimming range, table increment or table type. The parameters can either be given for each individual table or diagram, or the mechanism can be used which links a parameter to the same parameter in a different table or diagram.
In this menu the selection list as printed below appears, where for each table or diagram the different parameters can be set. The linked parameters mechanism is only discussed at the second option, Cross curve tables, for the application in the other tables is analogue. Also other options which are present at multiple types of tables are only discussed at their first occurrence, it will not be re-iterated.
At this option the parameters of the (to be computed and printed) hydrostatic tables can be specified, of which the most is the combination base unit, start value, increment and end value, here numbers can be entered, or <I> or <-I>, for ∞ and -∞ respectively, which makes the table to run from the largest or smallest possible value for this particular vessel. The base unit is the unit whose tabular values are fixed in this menu, and on basis of which all hydrostatic properties are computed and printed. For the hydrostatics, the possible table values are displacement (in metric tons), (mean) draft from base line and (mean) draft from Bottom of Keel. Apart from the base unit, the table range is fixed by the start value, the end value and the increment (the step size), which are obviously expressed in the base unit (so, in meter or in ton). One could also wish to have some additional table values, apart from the regular ones, for example exactly on summer draft (which, in general, will to coincide with a regular value). Such additional entries can be specified at the option [Number of extra values]. If the option [rounded increment] is set to yes, then the specified increment will not be applied exactly, but rounded-off to the nearest ‘nice’ value. This rounding-off always works (with an exception for Extra value)(if specified so), but is justified in combination with a linked parameter.
Finally, the trims for the tables can be specified, as well as the output format, which come in three:
This manual is not the place to discuss all hydrostatic parameters extensively, however, a few remarks are applicable:
Printing the tables is initiated with option Output according to the specified output sequence, where all tables specified in Specify output sequence will be computed and printed in one run. For an occasional print of only the hydrostatic tables the option [Print] can be used.
The setup for cross curves tables is similar to that of hydrostatics: base unit, start value, increment and end value. For cross curve tables there is a choice from three formats:
Next, there is the question to which side (PS/SB), the cross curve table will be calculated and printed. This is regulated by the setting as discussed in Calculate intact stability etc. with a heeling to :
For defining the various numerical parameters the optional link mechanism can be applied, where a parameter can be linked to the corresponding parameter from another table. In this fashion one can conveniently link the range and steps of the cross curve table to those from the hydrostatic table. This is achieved by selecting in the top-right column ‘linked to parameters of hydrostatics’, after which those hydrostatic parameters show up in the right column. For each parameter one can activate the link in the middle column, which make the hydrostatics parameter value to be used for the cross curves. This mechanism also covers a difference in base units; assume that the hydrostatic table is defined in terms of draft, and the cross curves in terms of displacement, then the hydrostatic drafts are converted to displacements. In general this will not result in ‘nice’ displacement values, however, with the [rounded increment] option (as discussed in the previous paragraph) these values will be rounded-off.
Please consider that this link mechanism is optional; it has been included for your convenience, in order to assist you to produce and reproduce the various tables in the same range, but application is not mandatory. After al you can always use naked parameters for each table, without any link at all.
The parameter menu for the cross curve diagram is similar to that of the cross curve tables. With the exception of the option [Connect points of curve of flooding through openings with straight lines]. For an explanation regarding this option see Settings intact stability and then Connect points of GZ-curve with straight line segments.
In case the option [Including curve which indicates the flooding through openings] is turned on then the meaning of the drawn lines is as follows. The light blue lines show, per opening, the flooding of that open opening. If such an opening becomes downflooded before the start value or after the end value, then this line will be omitted. It is possible that the KN sin(φ) line is split into a red and a green part due to an open opening becoming downflooded. Here the red part indicates that the ship is downflooded and that green part is safe.
In this menu the properties are specified of the Bonjean tables, which are tables of areas and vertical centers of gravity of all frames as defined in PIAS. The parameters in this menu are similar to those in the hydrostatic table menu.
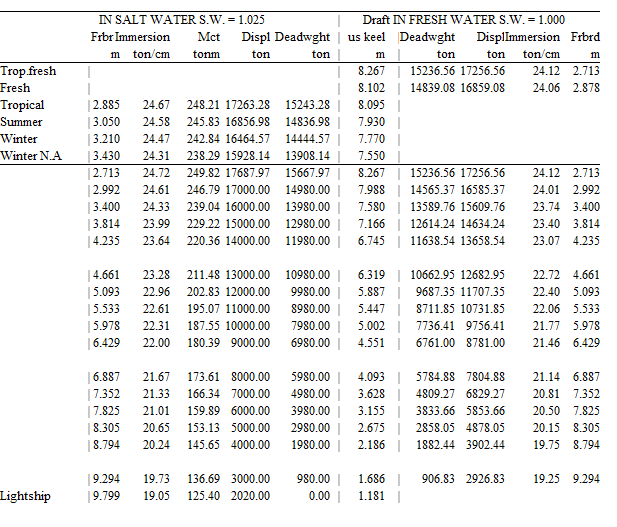
In this menu the deadweight table properties are specified. In order to produce such tables in any case the summer draft op the ship should be given correctly, this can be done in the main dimensions menu of Hulldef. If other freeboard-related drafts, such as WNA or FW, are also given (at Maximum drafts and minimum freeboards) then they will be incorporated in the table. In this particular menu only the draft or displacement increment and the light ship weight must be given, which will be evident. An example of a deadweight tables is depicted below.
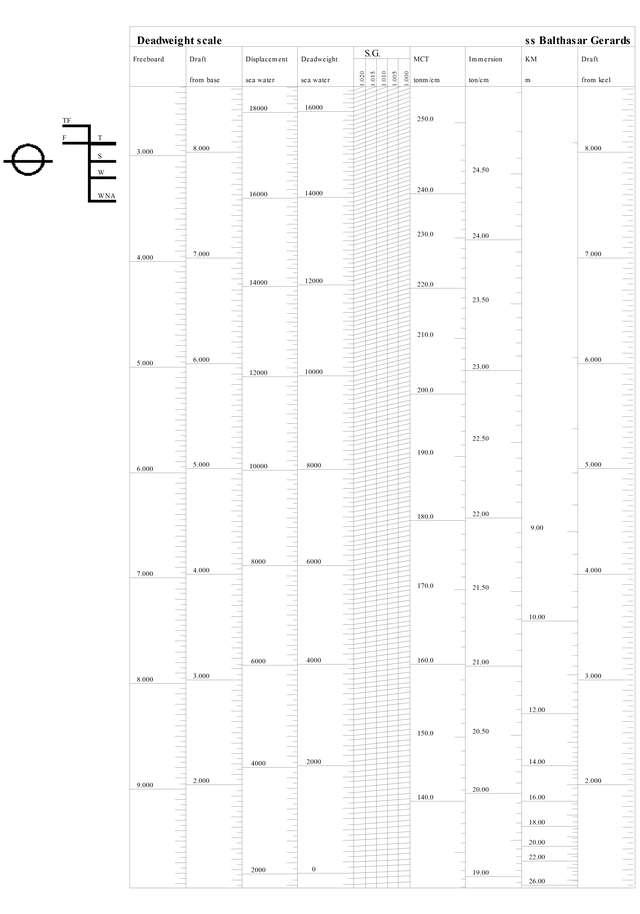
In this menu the deadweight scale parameters must be given, these come in two: In the first place the light ship weight — which is actually the same as for the deadweight tables — and secondly the question whether a Plimsoll mark should be included in the output. Obviously, for the latter the freeboard drafts should have been given at Maximum drafts and minimum freeboards. In a deadweight scale with a small draft range, by the way, combined with a plot of the Plimsoll mark, the latter may be drawn rather large. The reason is that the load line marks must coincide with the drafts in the deadweight scale, which leads inevitably to such an effect.
Here tables of wind heeling moments & wind levers can be configured and computed. The relationship between the various wind moment related input data is discussed in Wind heeling moments, it is recommended to visit that chapter. After choosing this option a window opens where the wind data (as introduced in Hulldef) are listed, accompanied in the first column whether it is selected. With <Enter> (or <doubleclick left mouse button>) opens a deeper level, where the step sizes (etc.) of the wind moment tables can be entered, completely analogous to the other tables here in Hydrotables. In a very rare occasion the wind heeling levers are already available from another source, in which case those values can be entered in the input module Hulldef, see Wind data sets.
Tables of wind arms are eventually printed for all combinations of selected wind data and selected wind contours. The printed wind moment table contains the following parameters:
However, there is one exception on this output, which occurs the wind heeling levers have been entered by the user (in Hulldef, as discussed above). In that case only draft, displacement and heeling lever will be printed, as the other parameters are not available.
For these tables of maximum allowable VCG' in intact condition also drafts and trims have to be specified, similar to those for the cross curves tables, as discussed in Cross curve tables. Additional parameters for the maximum allowable VCG' are:
The parameter menu for the this diagram is equal to that of the maximum VCG' tables.
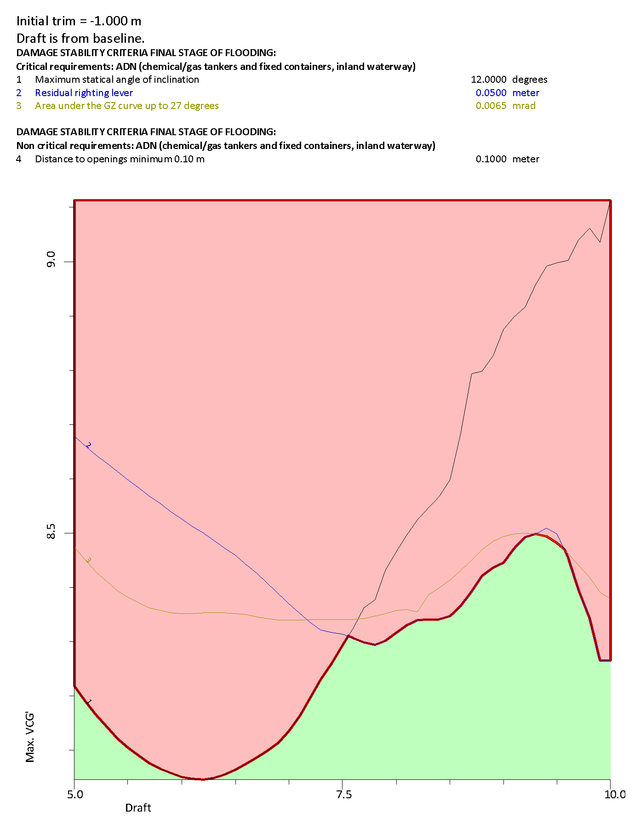
At this option the parameters can be specified which are relevant for the computation of tables and diagrams of maximum allowable VCG' in intact condition, required to fulfill damage stability criteria in case of flooding. This is a complex set of computations, so the required input data are somewhat more extensive than for the other tables in Hydrotables. So, first the following submenu appears:
In the first place, here the start value, end value and increment etc. can be given, which will now be familiar from the other types of tables here in Hydrotables. Specific parameters are:
Calculation of maximum permissible KG' covers many iterations and intermediate steps (such as the determination of maximum KG' for the individual stability requirements), for which it would certainly not be practical to include all those in the output. To understand exactly why a maximum KG' is as it is, there used to be the possibility of intermediate results to be stored in a file, which could afterwards be browsed. That option has been repealed because there are now more convenient options. The damage cases specified here can be imported into the deterministic damage stability in Loading, see [Import] in Input and edit damage cases. And once available in Loading, one can make a loading condition with exactly the critical KG' see what happens, and which criterion is most critical. Further details can be obtained by switching on in Loading the intermediate results of the stability assessment, in the column ‘intermediate results’ of the stability requirements menu, as described in Manipulating and selecting sets of stability criteria.
In this menu, which is discussed in detail in Input and edit damage cases, damage cases can be defined, with a maximum of 500. Please do not forget for each damage case to verify whether a compartment contains liquid in intact condition, because that will flow out in case of damage. For those cases their weight and density should be given in the last two columns of the damage case.
In the previous menu option it has been discussed how damage cases can be defined. For a limited number of damage cases this is not particularly laborious, however, in some occasions repeating combinations of root damage cases and tank fillings need to be defined (here the word `root damage case' indicates only a combination of damaged compartments, without tank fillings). With N root damage cases and M tank fillings, manually NxM damage cases should be defined. At large N or M it is more convenient to define the root damage cases and the tank fillings separately, and to generate all combinations. This facility is available in this menu, through four sub-options:
Here the regular intermediate stages of flooding can be given, as percentage of the final stage of flooding. The stages here are the same as defined for the deterministic damage stability calculations in Loading, see Define stages of flooding. Incidentally, there are many more considerations and possibilities regarding intermediate stages, which are discussed in Internal flooding in case of damage, through pipe lines and compartment connections.
With this option the calculation parameters of the floodable length curve are specified. This curve indicates the maximum length of any compartment at any longitudinal position, so that the vessel just submerges to the margin line in case this compartment is damaged. For this purpose a minimum of three points have to be defined as ‘margin line points’ in the PIAS module Hulldef. The parameters to be specified are:
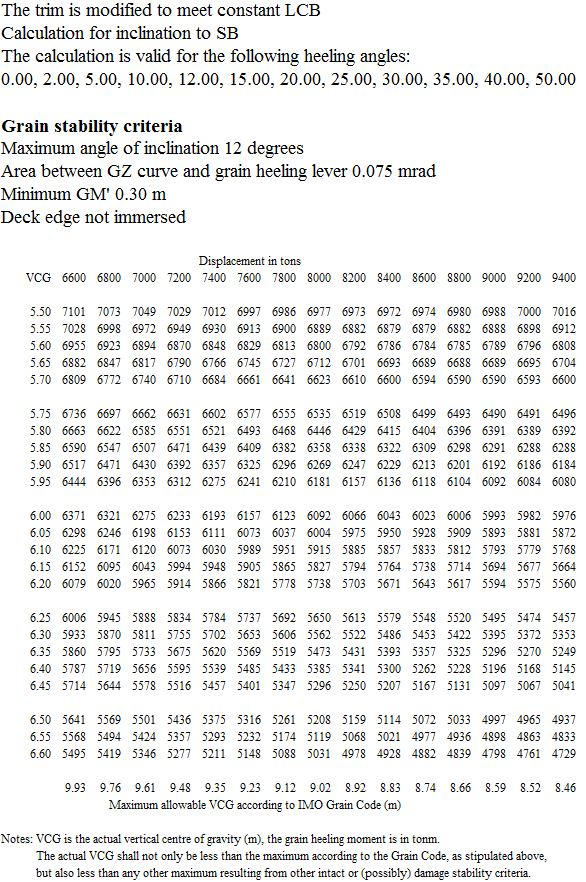
With this option the parameters for a maximum allowable grain heeling moment table — from which an example is depicted below — can be specified. These moments are computed according the requirements of the International Grain Code (IMO MSC.23(59)), for a range of drafts or displacements and VCGs. Besides the usual trims, as well as the draft/displacement range these parameters comprise:
The side (PS/SB) for which this table is valid depends from the setting as discussed at Calculate intact stability etc. with a heeling to :
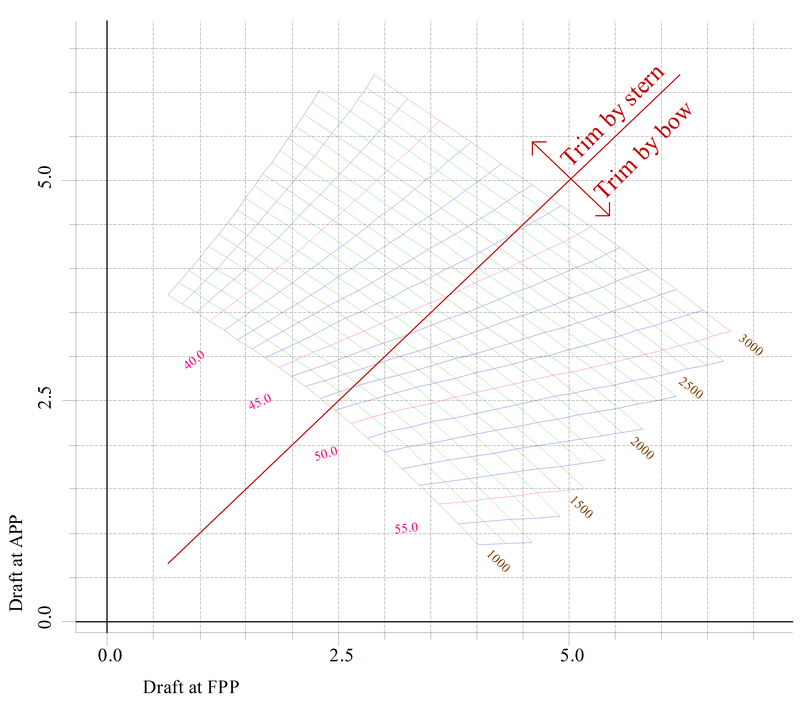
With the option the parameters for a trim diagram according to van der Ham (as published in the Dutch Schip en Werf journal, 25TH edition, 1958, No. 23) can be specified. In PIAS the Longitudinal Centre of Gravity (in combination with displacement) is plotted, instead of the Longitudinal Moment as in the original definition. The reason for this is that in PIAS the origin for all longitudinal distances is the APP, instead of Lpp/2 as used by van der Ham. With a van der Ham diagram the relations between displacement/LCG and drafts fore and aft can be read instantaneously, see the example below. The parameters for this diagram are:
With this option the parameters are defined for tonnage tables according the ‘Convention on the measurement of inland navigation vessels, Geneva, 15-2-1966’. The only extra parameters that still need to be defined, besides the usual increment and start and end value parameters, are the trims for the Light waterline(start value) and the Maximum waterline(end value). The table will than consist of a range of drafts, running from the start to end value with their respective trim, and by those drafts the interpolated trim and the accompanying tonnage.
In this menu the tables to be printed can be specified, as well as the print sequence. For each table also a page number and chapter name can be given, which will be printed at the bottom of each page. The left column, selected specifies whether the output of that line is actually included in the output to be produced.
When calculating the table ‘Maximum VCG' damaged and intact’ the parameters of Maximum VCG' intact tables are leading.
This option prints all tables according to their setup and print selection as specified in the previous two options. Obviously, their correctness will be dependent on the correctness of main particulars and settings, as can be given in Hulldef and Config, notably at:
With this option an XML file is generated which contains all, or at least all relevant, computation results of Hydrotables. This file is intended to be consumed by other software, for it is much more robust to import an XML file than to extract figures from human-centered output files. Please also refer to Export to and import from XML.
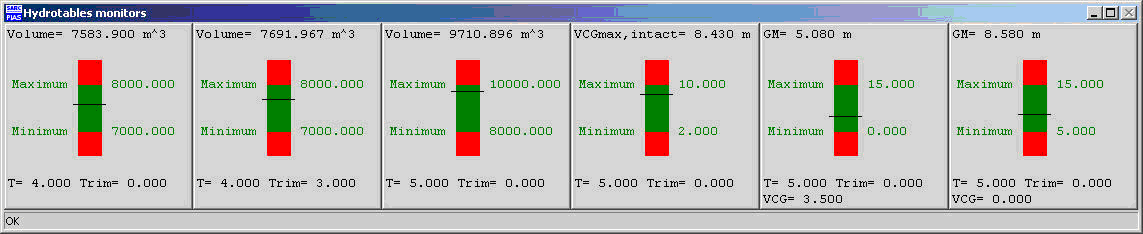
The local cloud concept is introduced in general terms in Local cloud: simultaneous multi-module operation on the same project. Hydrotables is able to `eavesdrop' the cloud, and to compute and show a number of hydrostatics-related parameters of the hull form, we call that the `local cloud' monitor of Hydrotables, its visual representation is shown in the next paragraph. In this menu multiple monitors can be defined, with per monitor:
With the previous option the local cloud monitors can be configured, with this options they can be activated. The effect will be that the main menu of Hydrotables is replaced by one or more bars, indicating the configured parameters and limits. The figure below shows an example, where the volume is monitored at three draft/trim combinations, the maximum allowable VCG' at one draft and the GM with two different VCG's. It might be a bit exaggerated example, however, it clearly shows the possibilities. Now all hull form modifications are monitored, so if with for example Fairway the hull form is changed, in this monitor directly the corresponding volume etc. will be shown.
Backups of the configurations for the tables and diagrams can be made and restored here. Here is also the option `Stop without saving the configurations'. For details we refer to Data storage and backups.