|
PIAS Manual
2024
Program for the Integral Approach of Shipdesign
|
|
PIAS Manual
2024
Program for the Integral Approach of Shipdesign
|
This module revolves around the resistance-trim graph that is available in the main window or in the loading modules using the Result Windows.
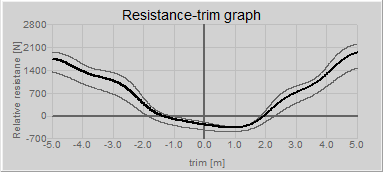
In this graph the resistance is plotted as a function of the vessel's trim, for a defined speed and the displacement of the current loading condition. When these change the graph is updated automatically.
The speed and de delta displacement can be set for the current loading condition using the settings menu Settings, in the tab 'Trim optimization'.
Aside from the main resistance-trim line, two other thinner lines can be plotted using the delta displace variable. The delta displacement is a deviation from the current vessel displacement in percentages, so that the effect of a change in displacement upon the resistance-trim graph can be seen at a glance. The delta displacement can be set in the settings menu, or highered or lowered using the scrollwheel of the mouse.
The unit of Y-axis of the graph is the relative resistance in Newton. The graph is scaled so that the current trim always has a value of zero on the Y-axis. The means that the effect for more or less trim is easily identified from the graph.